The June 2022 Bureau of Labor CPI reported consumer prices rose 9.1 percent from one year prior (Figure 1).[1] A key component driving up inflation continues to be the cost of gasoline, which reached $5.03 per gallon in June 2022. The Federal Reserve continues to raise rates to help counter soaring inflation, and prices on some items are starting to fall, but our industry may not see much relief any time soon.

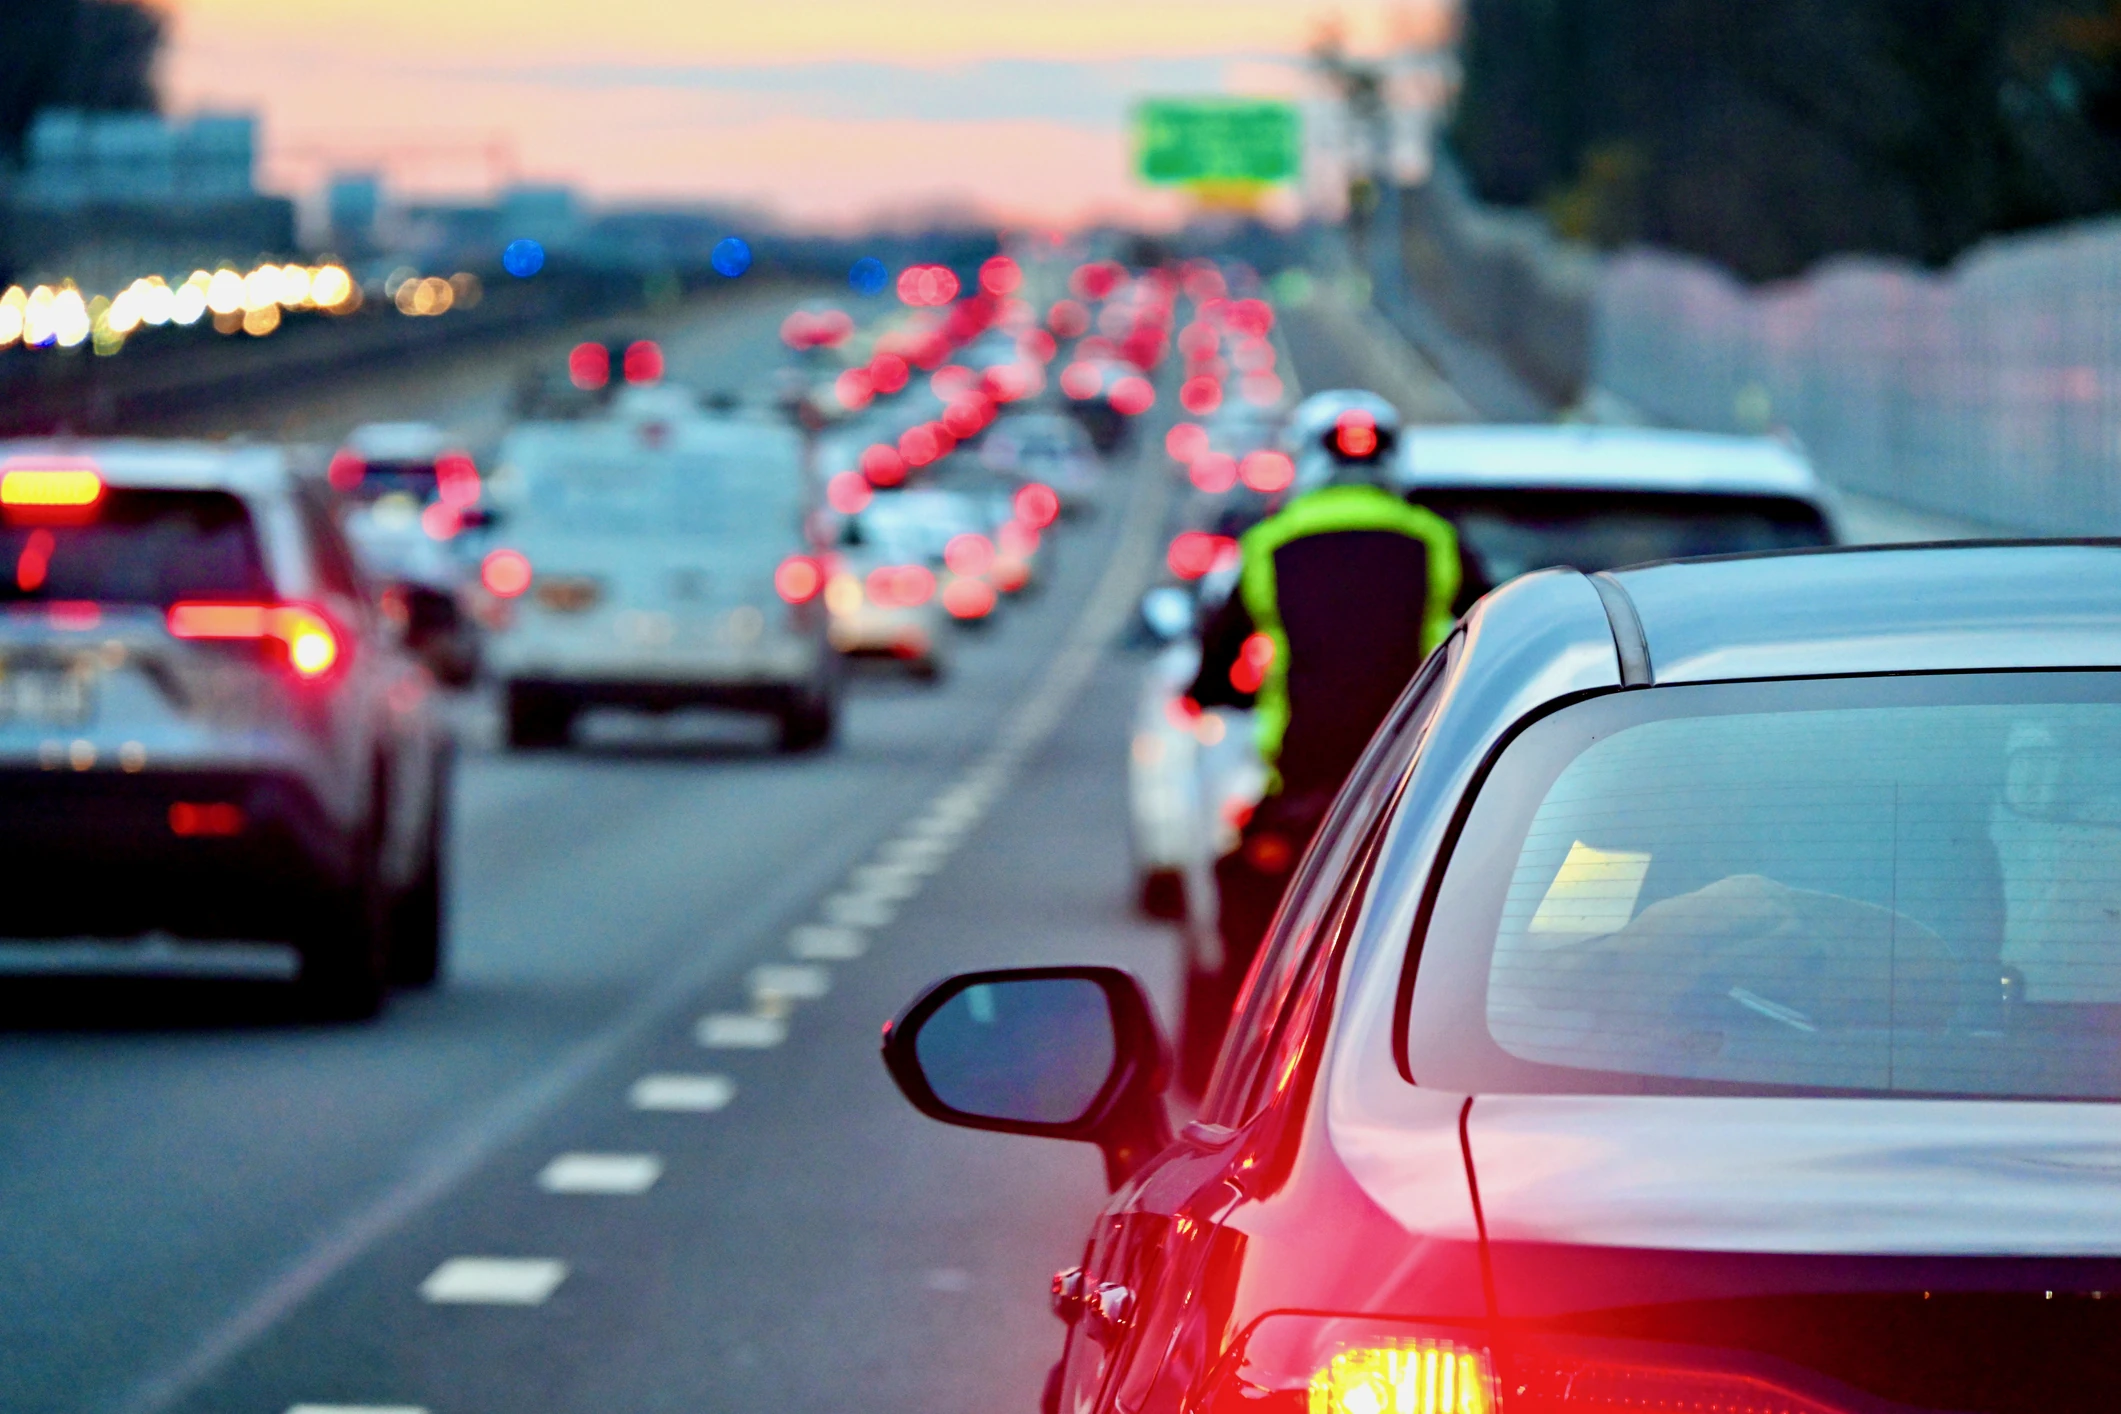
In this CCC Trends update, we will explore how soaring inflation in fuel prices, new and used vehicle prices, parts and labor, insurance, and more have impacted our industry. Gas Prices – Impact to Driving and Accident Frequency Since early July, gasoline prices began to decline slowly but remain elevated. U.S. regular gasoline retail prices averaged $4.11 per gallon in the first half of 2022 compared to $2.78 per gallon in the first half of 2021 (Figure 2).[2]

With gas prices hitting new records, there have been a lot of questions regarding the impact of higher gas prices on vehicle miles traveled and accident frequency. While there have been numerous studies showing there is some correlation, a lot depends on how much higher prices may go and how long the prices remain high. Here are some highlights from these studies: a) Researchers at the University of California at Davis found that from 1975 to 1980, each 10 percent increase in the price of gasoline resulted in a decline of gas purchased between 2.1 and 3.4 percent.[3]b) Analysis of vehicle miles traveled during the last recession (2007-2008) by the Congressional Budget Office found higher gas prices have a bigger impact on vehicle miles traveled (VMT) the longer higher prices persist.
- Their conclusion: a 10 percent increase in gasoline prices is estimated to reduce VMT by as little as 0.2 percent to 0.3 percent in the short run, and by 1.1 percent to 1.5 percent eventually.[4]
- The actual decline in VMT between 2007 and 2008 (when gas rose 38.3 percent between February and July 2008) was 1.9 percent, and the drop in person miles of travel was 1.8 percent.[5]
- Their analysis also found from 2003 to 2008, for every nominal increase of 50 cents per gallon of gasoline, median driving speeds on uncongested urban freeways fell by three-quarters of a mile per hour, and the amount of weekday traffic on freeways next to commuter rail systems declined by about 0.7 percent.
For the full year 2022, the Energy Information Administration forecasts U.S. regular gasoline retail prices will average $4.05 per gallon, and in 2023 $3.57 per gallon. By comparison, the price per gallon in 2021 was $3.02 per gallon and $2.18 per gallon in 2020.[6] Applying results from the analyses discussed above, vehicle miles traveled in the U.S. could potentially decline by as little as 0.4 in 2022 or by as much as 5.1 percent in 2022 (Figure 3).

Fewer VMT would have some impact on auto claim frequency, just as it has in past recessions (Figure 4). However, there are some important considerations that could mean we might not see any decline in auto accident frequency now.

- The labor market is much different today. Unemployment in the U.S. is at a historic low. At the end of June 2022, only 1.3 million Americans were collecting federal unemployment checks versus 6.5 million during the 2007-2009 recession.[7] The median increase in the U.S. unemployment rate among all 12 post-World War II recessions was 3.5 percentage points; and not one of the recessions had an unemployment rate below 6.1 percent.[8]
- Historically the most highly correlated variable to collision claim frequency has been congestion, or drivers per lane mile - high volumes of people on the same road at the same time.[9] An estimated 20 percent of full workdays in the U.S. are conducted remotely versus 5 percent pre-pandemic,[10] so fewer people are commuting to work during the traditional a.m. and p.m. rush hours. Despite this shift and despite higher gas prices, auto claim frequency continues to recover towards pre-pandemic levels (Figure 5).
- Demographic data from the U.S. Census Bureau, Brookings[11], and Moody’s[12] shows large numbers of individuals relocated over the last several years to suburban areas and to metro areas in the southwest and southeast where public transportation options are much more limited.
- Speeding and distracted driving remain elevated above pre-pandemic levels.[13]
- There remains a certain amount of driving that people must do like commute to work when no public transportation available or drive children to school; driving that gets reduced are those extra trips made for leisure or errands.
- Growth in e-commerce has also shifted mileage to trucks versus private passenger vehicles.[14]

The combination of these factors, as well as the relatively small decline in vehicle miles traveled during past recessions suggest that high gas prices and a possible recession will likely have only a minor impact on miles driven and accident frequency the remainder of this year and next. Inflationary Pressures Drive Auto Physical Damage Claim Costs As consumer demand surged in the second half of 2020, industries across the globe encountered significant supply chain constraints. One of the industries hardest hit was the auto industry, which found itself short of semiconductor chips used for numerous features in a vehicle like touchscreens, safety features, vehicle connectivity, and more. New and Used Vehicle Prices Soar Leading to Higher Total Loss Costs Auto production fell at a time when many people were looking for a vehicle coming out of the pandemic, so dealers and consumers rushed into the used vehicle market. A perfect storm of market conditions resulted in soaring inflation for new and used vehicles, which for the auto insurance industry has meant substantially higher total loss vehicle costs. Unfortunately, as the following factors discuss, higher total loss vehicle costs will likely remain in place for some time:
- After auto sales plunged to 10.4 million sales in 2009, recovery was strong, and by 2014 were back up to 16.5 million. Between 2015 and 2019, over 17 million new vehicles were sold in the U.S. annually (Figure 5). Low interest rates and large incentives from automakers meant consumers would often opt for a more expensive vehicle or higher trim level. Lease volumes were high, which meant plenty of supply for the used vehicle market. Today’s market is different.
- New vehicle sales fell in 2020 with the pandemic, but not as much as initially feared. Sales actually fell further in 2021 due to low inventories from semiconductor chip shortages, coming in at only 15 million in 2021, and 2022 sales are forecasted at 14.4 million.[15]
- Tight inventories and automakers focused on using the semiconductor chips on their most profitable vehicles have driven up the average new vehicle MSRP to over $45K. Higher raw material prices are also driving up the cost of EV’s which are seeing broader adoption in the face of high gasoline prices. Bureau of Labor’s CPI for new vehicles rose 2.4 percent in the first half of 2021, followed by 9.2 percent in the second half of 2021, and another 12.4 percent in the first half of 2022.
- Used vehicle sales on the other hand hit an all-time record in 2021 of 40.9 million – up 10 percent from 2020 (Figure 5). But forecasts for used sales in 2022 suggest they too will fall, to about 37.1 million[16], as high prices and lower inventories keep more consumers on the sidelines.
- Bureau of Labor’s CPI for used cars and trucks rose 20.7 percent in the first half of 2021, followed by 32.1 percent in the second half of 2021, and another 25.8 percent in the first half of 2022.
- Fewer new vehicles produced and sold in 2020, 2021 and 2022 – particularly to fleet and rental car customers, and through leases, mean inventories for used sales will be further constrained in coming years.
- Tighter used inventories with healthy demand mean used prices will likely remain elevated for some time, even as year-over-year gains have slowed, and may even turn negative in the second half of 2022. Monthly CPI data, along with data from Manheim and Black Book continue to show elevated used vehicle pricing/value, but the year-over-year increases have started to shrink (Figure 6).
- As of June 2022, used prices were up approximately 60 percent from June 2019. The largest year-over-year decline in the Manheim index occurred in December 2008, and that was a drop of -14.0 percent.

Given the factors outlined above, even if a recession were to occur in the second half of 2022, used prices might fall, but used vehicles and subsequently total loss costs will likely remain well above pre-pandemic levels for the remainder of this year and next. Part Costs and Delays Drive Up Repair Costs and Cycle Times Many industries like the automotive industry had moved to a just-in-time inventory system prior to the pandemic – an approach that has been sorely tested over the last two years with surging customer demand and recovering auto accident and claim counts. Inventories had been drawn down from plants being closed at the outset of COVID and have operated at lower levels of production due to shortage of necessary components and labor. Higher raw material prices, higher transportation costs from higher wages and fuel prices, record spot container shipping rates that tripled between June 2021 and June 2022 and are only slowly coming down[17], more money and time to unload goods at shipping ports, and shortage of employees on site. As a result of substantially higher costs for manufacturers and distributors, the cost of replacement parts has soared. Indexing the average cost per part across all part types from Jan 2001 forward illustrates just how substantial recent increases in part costs have been (Figure 7). The average cost per part rose 7.4 percent in 2021 versus 2020, and by June 2022 increased another 6.4% over 2021. Higher cost parts combined with continued growth in the average number of parts needing replacement with growing vehicle complexity has been a key factor driving up repair costs over the last two years (Figure 8).


Delayed parts delivery is also one of the primary reasons repairers driving down repairer productivity and throughput over the last two year. CRASH Network in Q1 2021 reported 96 percent of shops they surveyed were experiencing delays; by Q1 2022 and Q2 2022 that number was 98 percent and 97 percent respectively. So far in 2022, the national average scheduling backlog is over 4 weeks versus the pre-pandemic Q4 average backlog of only 1.7 weeks (Figure 9).[18] Shops continue to focus on blueprinting the repair to identify parts needing replacement and delaying the start of the repair until all parts have arrived on site. This is leading to delays in the average days from estimate completion to vehicle in for both driveable and non-driveable DRP repairs (Figure 10). These delays combined with the challenges outlined below are driving up claim and repair cycle times to record levels (Figure 11).


As supply chain issues improve, part price increases will likely slow, but just as with vehicle prices, it’s unlikely we will see significant reversal from current prices any time soon. Outside of seasonal fluctuations, (Figure 7) clearly suggests prices have historically only ever gone up. Collision Repair Technician Shortages Hamper Repairer Productivity and Drive Up Labor Costs Shortage of collision repair technicians has been an issue for the industry for some time but has been worsened over the last two years as overall labor shortages impact the industry further. Even before the pandemic Universal Technical Institute predicted a wave of retiring baby boomers would create 100,000 auto technician job openings over the next decade or so, with the Bureau of Labor Statistics projecting a 4 percent decline in employment in the overall auto technician field through 2029.[19]In fact, most repairers indicate the technician shortage has been the primary reason for longer backlogs of work. Repair work is up as auto accident frequency has risen. Many shops have indicated they cannot repair as many vehicles at the same time as they did before the pandemic, as repairer productivity (measured by labor hours per shop day) has fallen (Figure 12).

As repairers compete for a smaller pool of technicians, labor costs have risen. Data from the Bureau of Labor shows average weekly wages for collision repair employees have been increasing at a faster pace, with Q4 2021 average weekly wages up 7.5% from Q4 2020, versus an increase of 6.1% between Q4 2019 and Q4 2020.[20]Labor rates have also risen, with some of the largest increases in fifteen years (Figure 13). Higher labor rates combined with continued growth in the average number of labor hours per repair with increased vehicle complexity is another key factor driving up repair costs.

Unfortunately, the technician shortage does not have a quick fix; particularly in an environment where the labor pool overall is shrinking due to high numbers of baby boomers moving into retirement. Finding technicians with the right skillsets is also a growing challenge as vehicle complexity increases. These factors combined suggest labor costs will also continue to be a primary driver of higher costs in the future, because like the cost of parts, while labor rate increases, like inflation, may have been smaller in the past, historically they have never fallen. Likelihood of a recession in the second half of 2022 remains a concern. Historically recessions have led to some decline in auto accident and claim frequency; but conditions today suggest any decline would be less than in prior recessions. With higher cost vehicles, parts, and labor, and not much if any reduction in claims, it’s likely our industry will continue to experience elevated loss costs for some time.[1] www.bls.gov.[2] U.S. Energy Information Administration, Short-Term Energy Outlook: July 2022. https://www.eia.gov/outlooks/steo/, July 12, 2022.[3] American Public Transportation Association, “Potential Impact of Gasoline Price Increases on U.S. Public Transportation Ridership, 2011-2012.” March 14,[4] Congressional Budget Office, “Effects of Gasoline Prices on Driving Behavior and Vehicle Markets.” January 2008. https://www.cbo.gov/sites/default/files/110th-congress-2007-2008/reports/01-14-gasolineprices.pdf.[5] Ibid.[6] U.S. Energy Information Administration, Short-Term Energy Outlook: July 2022. https://www.eia.gov/outlooks/steo/, July 12, 2022.[7]https://www.wsj.com/articles/recession-economy-unemployment-jobs-11656947596.[8] Ibid.[9] CCC Intelligent Solutions Inc. Crash Course 2020, pp. 26-28.[10] Jose Maria Barrero, Nicholas Bloom, and Steven J. Davis. “Why Working From Home Will Stick.” Working Paper 28731, http://www.nber.org/papers/w28731.[11] Yung Chun, Tyler Haupert, Stephen Roll, Sophia R. Fox-Dichter, and Michal Grinstein-Weiss. “Did the pandemic advance new suburbanization?” www.brookings.edu. May 23, 2022.[12] https://www.wsj.com/articles/red-states-winning-post-pandemic-economy-migration-11657030536.[13] CMT. 2022 U.S. Distracted Driving Report.[14] https://www.fhwa.dot.gov/policyinformation/weeklyreports/.[15] Cox Automotive. “Cox Automotive Lowers Full-Year New-Vehicle Sales Forecast as Persistent Supply Problems Continue to Hold Back Auto Industry.” June 28, 2022. www.coxautoinc.com.[16]https://www.coxautoinc.com/market-insights/used-vehicle-market-looking-more-normal-in-inventory-as-prices-inch-down[17]https://www.wsj.com/articles/freight-rates-are-starting-to-fall-as-shipping-demand-wavers-11657454400[18] “Lack of parts, techs driving backlog mayhem.” CRASH Network, November 15, 2021. Volume 28, No. 43.[19] Scott Sturgis. “As auto repair goes high tech, top technicians can earn over $100K.” The Philadelphia Inquirer, March 13, 2021. https://www.inquirer.com/business/auto-car-repairs-jobs-training-salary-bmw-20210313.html.[20]https://collisionweek.com/2022/06/16/fourth-quarter-2021-average-weekly-collision-repair-wages-7-5-u-s-compared-2020/.