


A Year of Shifting Gears: How the Auto Claims and Repair Industry Adapted to Economic Strain and Evolving Technology in 2024
In 2024, the auto claims and repair industry faced a perfect storm, with challenges that included a softening economy, increasing repair costs, and a rapidly aging vehicle pool, forcing many to rethink their strategies. In this Q4 2024 edition of Crash Course, our analysts reflect on the year's defining trends to provide insights and guidance for navigating 2025.


2024 in Review
The following are the top trends that defined 2024 for the vehicle claims and repair industry.
CASUALTY INFLATION
Third party bodily injury claims jumped 8%, with the average payout per injured reaching $27,373.
AGING CAR PARC
Vehicles seven years or older now make up nearly 45% of all repairable claims, up from 35% in 2019.
DRIVING BEHAVIOR
Miles driven by consumers have increased 0.8% YoY through Q3, and up 0.6% compared to 2019. This could change with the new return-to-office policies.
ELECTRIC VEHICLES
EVs make up 6.8% of repairable claims for newer vehicles, but TCOR is only +19.1% since 2020, compared to hybrids (+51.5%).
UNINSURED MOTORISTS
Auto casualty claims involving uninsured and underinsured motorists rose by 11% in 2024.

2024 In Review
From shifting claims volumes to the rising costs of repair and the growing presence of electric vehicles (EVs) and hybrids, 2024 was a year of adaptation, with stakeholders working to stay ahead of the curve in an unpredictable environment.
One of the biggest shifts this year was inflation, which drove the cost of motor vehicle insurance up by 51% (since 2022), causing consumers to become more selective about filing claims for minor damages. Repairable claims of $2,000 or less – often seen as small but frequent – now make up just 26% of the mix, down from 43% in 2019.
Economic Strain and the Vehicle Car Parc
Underpinning the economic strain is an aging vehicle fleet – vehicles seven years or older now make up nearly 45% of all repairable claims, which is a sharp increase from pre-pandemic levels. This shift reflects the fallout from reduced new vehicle production during the pandemic, which created a gap of over 13 million vehicles.
The aging vehicle pool had a significant impact on total loss frequency this year. With used vehicle values declining and older cars making up a larger share of claims, total losses reached a record high, accounting for 22% of all claims through October. Fewer new cars on the road and elevated prices for both new and used vehicles meant older cars stayed in circulation longer. While repair costs for older vehicles remained lower than for newer models, total losses soared as their values continued to drop.
For the first time since the pandemic, new vehicle inventories began to rise, reaching over three million units by November. Yet, despite the recovery in availability, elevated vehicle prices and high financing costs kept sales below pre-pandemic levels. The average new vehicle transaction price hovered around $48,623, and financing rates, though easing slightly, remained a barrier for many buyers.
Between the high purchase costs, loan rates, and auto premiums, 2024 saw an uptick in uninsured or underinsured motorists (UM/UIM) claims – notably, auto casualty claims - as consumers struggled with affordability. This trend is not just a byproduct of lower vehicle values and inflation – it's also driven by the increasing claims costs.
Rising Repair Costs and Vehicle Technology
Collision repair shops were caught in a balancing act throughout 2024, as rising costs continued to squeeze margins. Labor rates were up by 4.7% in 2024, based on CCC data, rising faster than inflation and while repair cost increases slowed compared to the double-digit jumps of 2021 and 2022, total repair costs still rose by 3.7%, driven primarily by labor.
EVs, though still a small portion of the vehicle pool, are increasingly a factor in repair dynamics, representing 6.8% of repairable claims for vehicles three years or newer in 2024. This was a significant jump from just 1.4% in 2020. Despite the perception that EV repairs are more costly, the total repair costs for EVs have increased more modestly – just 19.1% since 2020 – compared to the steep 51.5% rise in repair costs for hybrids. Hybrids now represent 13.2% of claims for vehicles three years or newer.
As the market for EVs grows, repair shops must adapt to the complexities of these vehicles, which require more labor hours per repair, contributing to rising costs and longer cycle times. But there was good news for repair shops. After enduring prolonged backlogs in 2022 and 2023, cycle times began to improve in 2024. The average time for vehicles to enter the shop after an estimate was completed dropped by nine days compared to Q3 2023.
Shop productivity also improved slightly by Q3 2024, as vehicles were able to get into shops for repairs nine days sooner than in Q3 2023. During this time, cycle times incrementally decreased with repair times down by 1.4 days per repair. This could signal that the industry is slowly recovering from pandemic-induced delays. However, productivity remains below pre-pandemic levels, underscoring the lingering effects of labor shortages and increased complexity in vehicle repairs.
Medical Costs and Auto Casualty Inflation
Another significant challenge that has persisted in 2024 is the rapid inflation of medical costs associated with auto casualty claims. Both first party and third party auto medical billing inflation far outpaced the CPI for healthcare this year, reflecting profitability pressures on the healthcare system which have persisted over the last few years.
High-cost procedures such as CT scans, steroid injections, and outpatient surgeries have inflated considerably, as well as increased in frequency. Additionally, many of these same outpatient surgery and radiology procedures appear earlier in the treatment cycle than in previous years, which contributes to rising claim severity.
In 2024, the average third-party bodily injury claim payout rose by 8%, with the average cost per injured party increasing to $27,373. These rising costs, coupled with higher claim frequency for uninsured and underinsured motorists, are creating additional pressure on insurers. The percentage of casualty claim submissions involving UM/UIMs grew by 11% in 2024, a reflection of both economic strain and the increasing number of drivers carrying inadequate coverage or driving without any insurance.
The combination of increased medical procedure costs and higher severity claims could continue to adversely impact liability loss ratios in 2025. As auto insurance premiums continue to rise, consumer dissatisfaction may grow, leading to further increases in uninsured/underinsured motorists and policy shopping/switching, the latter of which is already at historic highs.
Customer Experience and Retention
In 2024, customer experience and retention became even more critical for the auto insurance and repair industry as consumers demanded more seamless and transparent experiences.
CCC’s Moments of Truth study revealed that policyholders view the claims and repair process as a unified journey, with both insurers and repairers sharing responsibility for the overall outcome. Clear communication about the claims process and transparent and detailed explanations of vehicle repair needs were the top drivers of satisfaction for insurers and repairers, respectively.
Interestingly, while high customer satisfaction scores are often seen as indicators of loyalty, they don't predict retention well. The report identified three key factors that significantly increase the likelihood of policyholder defection: being upside down on a loan in a total loss situation and being affluent enough to cover the loan gap, having either a first- or third-party injury during the accident, and being a first-time claim filer with any insurer. When all three factors are present, the chances of switching insurers increase more than threefold.
Empathy and communication emerged as critical "moments of truth" throughout the journey, especially for those who experienced injuries. Customers responded positively to timely updates and digital communication, like text messages from repair facilities. Additionally, satisfaction with repairers had a direct impact on perceptions of insurers, with 42.5% of respondents stating that their experience with the repair shop altered their view of the insurance provider -- mostly for the better.
The report highlighted the need for insurers and repairers to collaborate more closely, ensuring that they jointly "win" the moments of truth. By aligning their efforts, insurers and repairers can improve customer satisfaction scores in an increasingly competitive market.
Looking Ahead: The "Collision" of Technology and Economics
As the auto claims and repair industry looks towards the new year, the trends of 2024 may provide a roadmap for what’s to come. The growing presence of EVs and hybrids will continue to challenge repair shops and insurers alike, while consumer affordability challenges – driven by inflation and rising costs – will remain a key concern. Additionally, escalating medical costs in casualty claims could create significant headwinds for insurers, pushing them to find new ways to manage both claim severity and consumer premiums.
The balancing act between controlling repair costs, managing casualty inflation, and adapting to new vehicle technologies will define the year ahead. For insurers, next year’s challenge lies in navigating these economic pressures while maintaining profitability.
Triple-I/Milliman estimated the P&C industry's net combined operating ratio (NCOR) at 99.4% in October 2024, slightly improved but still strained. With the auto insurance market facing higher costs and persistent profitability challenges, the industry will need to find new ways to manage claims and keep costs down while meeting the needs of an evolving vehicle fleet.
Additionally, there is growing uncertainty from geopolitical volatility in the form of proposed tariffs/trade wars with key nations in the auto supply chain including Mexico, Canada, and China. While the situation remains extremely fluid, it has the potential for inflationary impacts.
As the road to 2025 continues to twist and turn, insurers and repairers will need to stay nimble, finding new ways to keep up with the economic realities, vehicle technology, and shifting consumer behaviors that have defined 2024.


Triple-I/Milliman estimated the P&C industry’s net combined operating ratio (NCOR) at 99.4% in October 2024 – slightly improved but still strained – prompting the industry to find new ways to manage claims and keep costs down while meeting the needs of an evolving vehicle fleet. (Figure 1)
APD TRENDS

Economics & Vehicle Costs
Vehicle Sales & Vehicles in Operation
While reduced new vehicle availability at the onset of the pandemic led to decreased new vehicle sales, those challenges have largely been replaced by a different set of economic barriers.
According to the Federal Reserve Bank of St. Louis, Total New Light Weight Vehicle Sales remain below 16 million vehicles on a 12-month moving basis. The U.S. averaged 17.26 million new lightweight vehicles sold on a 12-month moving basis from September 2015 through February 2020. (Figure 2)

A recent report from Cox Automotive stated that new vehicle inventory exceeded three million units in November – the first time since the pandemic – and is up by over 677,000 units year-over-year. Consumers continue to face elevated new vehicle prices; October average transaction price was $48,623. And, for almost two years, the average new vehicle financing rates had been 7% or higher.
For the first time in almost two years, the average new vehicle APR dropped below 7%, as Edmunds reported rates at 6.8% for November; the average used vehicle APR was 11%, down from 11.5% in June.
Consumers continue to confront the long-term effects of vehicle-related cost increases. 17.4% of new auto loans have a monthly payment of $1,000 or more, down slightly from 17.9% in Q4 of 2023. Edmunds reported that as of Q3 2024, 24.2% of new vehicle sales with a trade-in had negative equity, and that consumers who are upside down in their auto loans owe an average of $6,458. 22% of consumers with negative vehicle equity owe $10,000 or more on their loan. It is notable that 30% (or more) of new auto loans had negative equity between Q1 2018 and Q2 2021.
As of Q3 2024, auto loans accounted for 9.2% of total household debt (the quarterly average has been 9.3% since 2016). Total auto loan debt in the U.S. exceeds $1.6 trillion.
According to the New York Federal Reserve Bank, 2.9% of auto loans became 90+ days delinquent in Q3 2024, up from 2.5% in Q3 2023. Though high, delinquency rates are below those of the financial crisis era, where rates were as high as 3.48% (Q2 2009).
According to Experian, 291.1 million total vehicles were in operation through Q2 2024. Experian also reported that 11.9 million vehicles were taken out of operation.
According to S&P Mobility, the average U.S. vehicle age has now increased to 12.6 years, reinforcing the trend toward a more mature U.S. vehicle pool.
66% of vehicles in operation are seven years or older.
Paid Claims Frequency Trends
According to FastTrack’s paid claim frequency trends, through Q2 2024, Auto Collision frequency has decreased to 5.17, the lowest since Q4 2021 (5.12). It is noteworthy that annualized collision exposure units – measured by earned car years – are down 2.0% year over year, while paid collision claims are down 5.7%.
Liability (Property Damage) claims frequency has also flattened out over recent quarters and remains well below historic norms. Liability exposures are down 2.7% year-over-year and paid claim volume is down 3.6%.
Comprehensive paid claim frequency remains at or near historic levels, much of which can be attributed to weather events. The underlying metrics for comprehensive frequency reveal a 2.4% decrease in exposures and a 2.8% decrease in paid claim volume year-over-year. (Figure 3)

Miles driven are +0.8% YoY through Q3 and +0.6% compared to 2019 (pre-pandemic). However, dangerous driving behaviors – speeding, distracted driving, aggressive driving, and impaired driving – continue to plague America's roadways. Following Amazon's announcement which will bring employees back into the office full time in January 2025, many major firms have followed suit, which could imply an increase in miles driven, congestion, and potential crash frequency over time.
Consecutive years of poor loss performance continue to drive auto insurance costs higher. The October consumer price index for motor vehicle insurance is +9.0% YTD, +14.0% YoY, and +51.4% compared to 2019. Inflation for all items has increased by 2.3% YTD, +2.6% YoY, and is +50.9% compared to January 2022. (Figure 4)

The Insurance Research Council reported that 14% of drivers are uninsured and J.D. Power reported that 5.7% of American households with at least one vehicle do not have insurance. (Figure 5)
Factoring in the aging car parc, consumers with older vehicles could be more prone to increasing deductibles or dropping first party coverages, decreasing policy limits, or electing to go without insurance altogether. In fact, 22.1% collision claims had a $1,000 deductible in Q3 2024 – up from 19.7% in Q1 of 2023 – while those with a $500 deductible have decreased from 52.9% of collision claims to 48.6%. For comprehensive claims, $1,000 deductibles represented 17.4% of claims in Q3 2024, up from 13.6% in Q1 2023. The share of claims with deductible amounts of $500 or less all declined during this same period.

Used Vehicles
Used Vehicle Values
Through October, the CPI for used cars and trucks is –3.4% YoY. Wholesale indexes, which generally serve as leading indicators for retail pricing, reflect any further decreases. Year-over-year, the Manheim Used Vehicle Value Index is -3.2% through October, and the Black Book Used Vehicle Retention Index is -8.6% during that same period. (Figure 6)

Total Loss Frequency
Year-over-year through October 2024, CCC data indicates a 2.0% increase in vehicles flagged total loss in 2024 relative to 2023, primarily due to the continued erosion of used vehicle values and an increasingly mature vehicle pool, as almost 72% of valuations across all loss categories are for vehicles 7 years or older. (Figures 7 and 8)


An increased total loss frequency will, conversely, decrease the ratio of repairable vehicles. Higher physical damage severity losses, which might have been repaired a year ago, are more likely now to be totaled, increasing shop capacity and lowering overall cycle times.
While these appear to be promising signs for consumers, used vehicle price volatility is not without its pitfalls in the current economic conditions. As used vehicle prices continue to decrease, the possibility of consumers being underwater due to unfavorable loan terms increases. Transunion reported in November that the share of used vehicle loan originations with a loan-to-value (LTV) ratios over 120% has more than doubled over the past three years – from 25% in Q3 2021 to 54% in Q3 2024.
Between 2020 and 2022, the average adjusted vehicle value increased by almost 49%, from $10,184 to $15,134, according to CCC's total loss valuation data. Through October 2024, CCC has seen an overall decrease of -6.4% YoY, with an average adjusted vehicle value of $13,612. (Figure 9)

As vehicle values decrease, segments of ancillary coverages, such as GAP (guaranteed asset protection) coverage, could be required to cover larger payouts than anticipated. Understanding how asset values are shifting could be an additional step product, pricing, and underwriting departments could undertake to ensure pricing adequacy amidst market fluctuations.
Vehicle Theft
According to NICB, there were 1,020,729 vehicle thefts in 2023, a 1.2% increase relative to the revised total for 2022 of 1,008,756 thefts. 208,668 (20.4%) of thefts were in California, followed by 115,013 (11.3%) in Texas. States with the largest YoY increases include:
- Washington DC (+64%)
- Maryland (+63%)
- Connecticut (+33%)
The percentage of total losses because of theft continues to remain above historic norms yet following peaks in 2022. Some vehicle segments do indicate subtle increases in total loss thefts of recent. (Figure 10)


VEHICLE REPAIR TRENDS
The vehicle repair industry has shown signs of improvement following the apex of prolonged cycle times and elevated costs that bled into 2023 after an especially challenging Q4 2022.
Historically, auto physical damage loss development is relatively swift; however, recovering backlogs and prolonged cycle times continue to delay the maturation of data. The average TCOR through Q3 2024 currently stands at $4,667 – a 3.7% increase relative to Q3 2023 ($4,501). 2024 trends indicate that TCOR increases are beginning to fall back in line with inflationary trends. (Figure 1)

Parts Costs Stabilize
Parts Costs
Following years of 7.3% and 5.4% increases in average parts costs, the average price per part increased a modest 0.2% in 2023. Through Q3 2024, the average price per part is +1.4% year-over-year following increases of +2.0% and +1.2% in the second and third quarters of 2024. (Figure 2)

The rate of change for the average number of parts per appraisal has reversed slightly after consecutive years of large increases. The average went from 11.2 parts per appraisal in 2020, to 12.2 in 2021, 13.2 in 2022, and 13.7 in 2023. Year-to-date 2024 currently stands at 13.4 parts per repair. (Figure 3)

Total Cost of Repair (TCOR) Contribution
Total repair costs jumped double-digits in 2021 and 2022. When indexed against 2020, parts contributed at least 50% to the increased repair costs. Parts costs, however, have been trending down in their overall contribution to repair cost increases. The largest increases in contribution have been from labor and miscellaneous costs, which often include diagnostics. (Figure 4)

Labor Rates
The average number of labor hours per appraisal in 2023 increased slightly to 27.6 hours, also following large jumps in back-to-back years (2021 and 2022). Through Q3, labor hours are down slightly year-over-year at 27.3 hours. (Figure 5)

The primary driver of overall repair cost increases in 2023 and 2024 has been labor rates, which were up 7.5% in 2023 and a 4.7% increase year-over-year through Q3 2024. What's notable here is this labor rate increase began in 2022 and continued through 2023 into 2024, whereas the number of labor hours, parts volume, and parts prices saw their largest increases a year prior – in 2021 and 2022. (Figure 6)
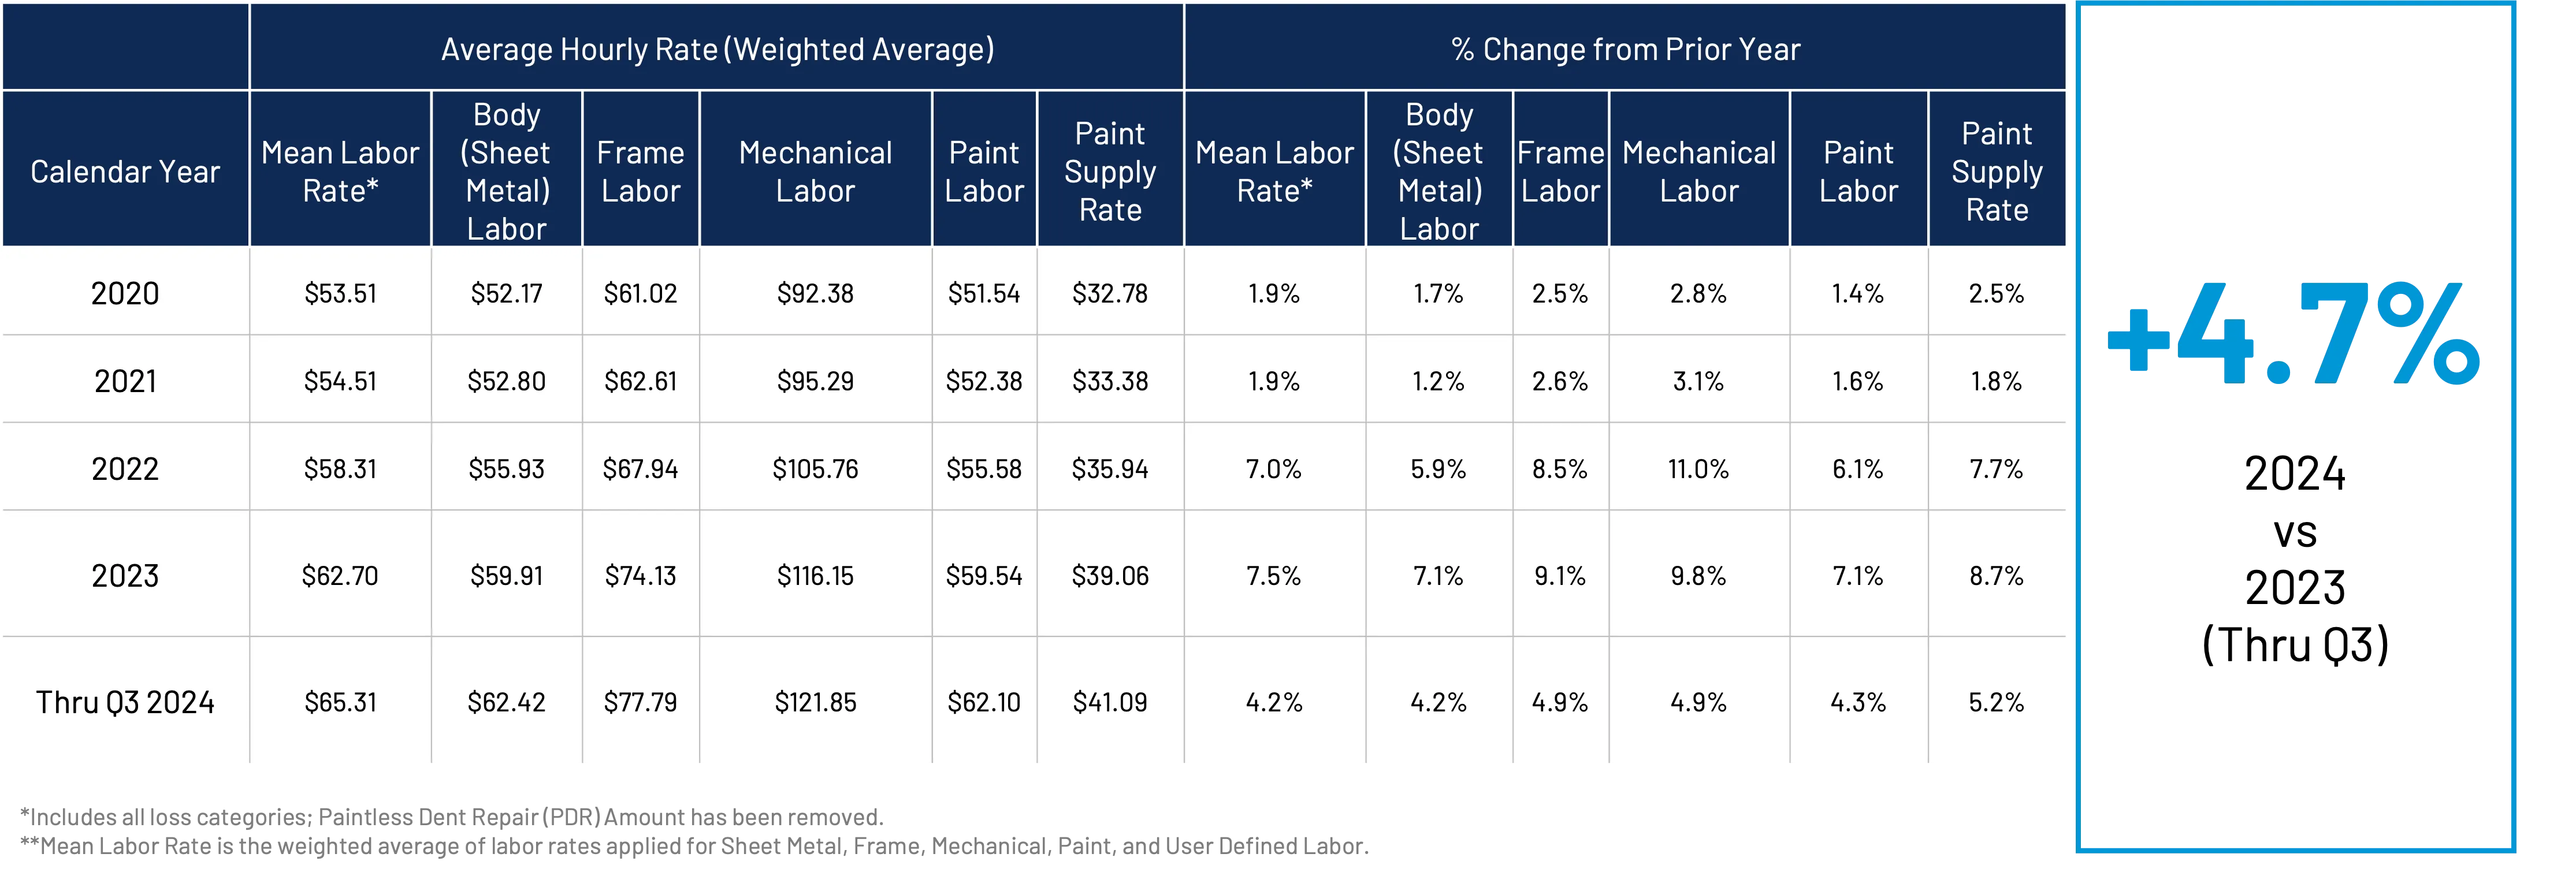
Mean labor rates from estimates are lagging 9 months behind general inflation - the consumer price index for all items. YoY labor rate increases peaked in February of 2023 as opposed to general inflation, which reached its apex in June of 2022. (Figure 7)
As inflation began to level out entering Q4 of 2023, prior trends indicate that we could see labor rate increases continue to decline or flatten as we conclude 2024.
(YoY% Change by Month)

Productivity and Cycle Times
Cycle times – including time between appraisal completion, vehicles going into the shop, and repair time – continue to improve, though both productivity and cycle times still lag pre-pandemic levels. Based on the current data, Q3 2024 continued to see incremental decreases in cycle times, as vehicles were able to get into shops for repairs nine days less than in Q3 2023. Also, average repair times are down by 1.4 days per repair. While these trends are likely to develop further, they are indicative of decreased shop backlogs, lower severity repairs, and continued, albeit slight, improvements in productivity. (Figure 8)

Q3 2024 data currently reveals consistent quarter-over-quarter drops in average time for vehicles to go into a shop for repairs following estimate completion. While we should anticipate recent results to increase slightly for this metric as the data develops, the general trend reflects continued improvements in shop backlogs. (Figure 9)

This is also reflected in Crash Network’s U.S. National Collision Repair Scheduling Backlog, which was reported at 2.1 weeks for Q4 2024. Backlogs apexed at 5.8 weeks in Q1 of 2023 and have plummeted in 2024; Q1 of 2024 was 4 weeks. (Figure 10)

Additionally, shop productivity – measured in labor hours per repair day – continues to see slight improvement quarter-over-quarter. Productivity should remain a focal point for the collision repair industry. As compared to pre-pandemic levels, productivity can add up to four additional days for drivable vehicles and up to eight days for non-drivable vehicles. (Figure 11)

Electric & Hybrid Vehicle Segments Continues to Grow
Despite evolving customer sentiment, slow infrastructure execution, and relatively high average new vehicle prices, the electric vehicle segment continues to grow. Electric Vehicles (EVs) now make up 1.1% of vehicles in operation (~3.3 million vehicles) while internal combustion engine vehicles account for 92% of the mix. EVs represented 2.5% of all repairable claims through Q3 of 2024, as EV repairable claims volume is up 27% year-over-year. (Figure 12)

The mix of claims for vehicles three years or newer continues to evolve as EV and hybrid vehicles increase market share. Internal combustion engine vehicles (ICE) represented 95% of claims for vehicles three years or newer at the beginning of 2020 and now represent 80% of claims. Hybrid share has increased from less than 4% to over 13% over the past five years. And, EVs three years or newer account for almost 7% of claims, up from 1.4%. (Figure 13)

The EV car parc remains relatively young in comparison to the mature U.S. vehicle pool. Through Q3, 79.4% of repairable EV estimates are for vehicles three years old or newer; 60.3% of repairable hybrids are three years old or newer. Only 26.3% of repairable ICE vehicles are three years or newer; in fact, 47.4% of repairable ICE vehicles are seven years or older. (Figure 14)

EV and Hybrid Repair Costs
According to Cox Automotive, the average new vehicle transaction in October 2024 was $48,623 while the average electric vehicle was $56,902 (17% higher than the average transaction price). The average EV costs 49.8% more than the average ICE vehicle to repair and ~22% more than the average hybrid vehicle. However, as we must emphasize, this is not an apples-to-apples comparison.
The internal combustion engine segment of the car parc, as noted previously, is larger and more mature than the emerging EV and hybrid segments.
For vehicles three years old or newer, the average TCOR through Q3 2024 for EVs was $6,939.97, which was 23.5% higher than ICE vehicles and 8.6% more than hybrid vehicles within the same age group. The average hybrid TCOR for vehicles three years or newer is 13.7% more than ICE vehicles – a gap that continues to increase. (Figure 15)
A complete high-level summary comparing EVs, hybrids, and ICE vehicles by age can be found in Figure 16.


Cycle Times
For 2024, the average time between last estimate and vehicle out has declined to 37.6 days for electric vehicles, down from 59.3 days in 2020. Hybrids have an average cycle time of 30.9 days, while combustion engine vehicles are averaging 32.3 days. These improvements can be attributed to the increase in total losses, decreased backlog, and improved productivity. In the case of electric vehicles, familiarity with the EV platform, as well as the continued growth of the EV segment with legacy manufacturers, are likely factors contributing to the cycle time improvements. (Figure 17)

Valuation Trends
A comparison of the percentage of vehicles flagged total loss by age for EVs, hybrids, and ICE vehicles indicates that, overall, EVs are being totaled less than their non-EV counterparts.
While the ICE vehicle segment skews older, hybrids also represent an older mix than EVs. In taking a closer look at more recent model years, EVs are flagged total losses slightly more frequently than non-EVs for current year or newer vehicles in 2024. In all, only 11% of EVs have been flagged total loss in 2024. (Figure 18)


CASUALTY Trends Summary
While material damage inflation has cooled, the combined effects of auto medical billing inflation and social inflation continue to adversely affect auto casualty lines. Impact severity is tracking slightly higher than prior year as speeding and distracted driving trends persist despite improving safety technology. Both first and third party auto medical billing inflation continues to outpace CPI for medical care.
Radiology, Surgery, and Eval & Management continue to increase as a percentage of all procedure dollars, driven by gains in both frequency and cost of high dollar procedures such as CT Scans, Steroid Injections, and ER Physician bills. Outpatient surgery and radiology (MRI) procedures continue to appear earlier in the treatment cycle than previously observed. Platelet-rich plasma therapy (PRP) continues to increase rapidly in frequency within auto billing. Auto premium increases continue to fuel unusually high rates of policy shopping and switching, as well as growth in uninsured and underinsured motorist (UM/UIM) injury claim submissions.
Third Party Claims
Impact Severity
The average Delta-v has increased slightly as of 2024 YTD. (Figure 1)

Claims Frequency
Paid bodily injury frequency has been increasing very slowly since 2022 although remaining roughly 15% below pre-pandemic baseline. (Figure 2)

Claims Indemnity
Average third party bodily injury paid outcome is now $27K per injured party, which represents an 8.3% increase since Q2 2023 and a 38% increase since Q2 2020. (Figure 3)

Medical Care Inflation
Auto Medical Billing vs CPI Health Care
Both first and third party auto medical billing inflation rates have been consistently outpacing the Consumer Price Index for health care. (Figure 4)

Third party bill line severity has increased 4.7% since Q3 2023. (Figure 5)

The largest severity increases in key volume states since Q3 2023 have occurred in California, Pennsylvania, Arizona, and North Carolina. (Figure 6)

Procedures
Distribution of procedure dollars shows increases in Radiology, Evaluation & Management, & Surgical as of Q3 2024 (Figure 7). Drilling further into procedure category gains, price increases occurred in nearly all subcategories, with bill frequency increases also occurring for CT Scans, MRIs, X-Rays, Surgeries, Injections, and most Eval & Management. (Figure 8)


Earlier Outpatient Surgery & Radiology
The average days between date of loss and treatment continues to decrease for outpatient surgery and diagnostic procedures, with notable cost increases on those same procedures. (Figure 9)

Rising PRP Treatment Frequency
The PRP procedures continue to increase rapidly in frequency. PRP code 0232T is now the 6th highest surgical procedure by total dollar amount billed. (Figure 10) And the largest concentration of PRP utilization is in California, followed by Georgia, Florida, and Texas. (Figure 11)


Affordability
Uninsured or Underinsured Motorists
The percentage of third party claims submitted for injuries caused by an uninsured or underinsured motorist remains elevated (+11% since Q3 2023). This is consistent with unusually high inflation of personal auto premium costs driving increased policy shopping and higher uninsured/underinsured rates. (Figure 12)

First Party Frequency and Indemnity
PIP claim frequency is down 3.1% since Q2 2023, although it increased slightly since prior quarter. (Figure 13) PIP claim paid outcome per injured party increased 3.6% from Q2 ‘23 to Q2 ’24. (Figure 14)


Medical Billing Costs
First party bill line severity has increased 9% since Q3 2023. (Figure 15)

For key volume states, the most notable line level increases since Q3 2023 have occurred in Michigan, Colorado, Minnesota, North Carolina, California, New Jersey, and Florida. (Figure 16)

Distribution of procedure dollars shows notable increases in Radiology, Surgical, and Eval & Management as of Q3 2024. (Figure 17)

Drilling further into Radiology, Surgical, and E&M growth, movement is driven by both cost and frequency increases within most procedure subcategories. (Figure 18)


Learn more about our Crash Course authors

Kyle Krumlauf
Kyle Krumlauf brings more than 20 years of industry experience to his role at CCC, having served in various leadership and individual contributor positions at Nationwide and Grange Insurance. He was awarded a CEO Award at Nationwide in 2014 for Innovation & Continuous Improvement, and an Accolade Award at Grange in 2019 for his work in Innovation. Kyle earned a BA in Political Science and History from Ashland University and an MBA from Ohio Dominican University. He also holds the CPCU and ARM designations.

Erik Bahnsen
Erik Bahnsen has spent 20 years in the insurance industry, first holding several auto- and casualty-focused claim roles on the insurer side before moving into technology. Erik joined CCC in 2012, with numerous roles in account management, leadership, and product innovation, with a focus on casualty. Erik also participates in the ongoing development of CCC's industry-leading analytics and AI products. Since joining the industry analyst team in early 2022, Erik’s industry analysis and thought leadership content has been presented and featured in numerous industry meetings and influential publications.
Note: Where CCC Intelligent Solutions Inc. is cited as source, the data provided is an aggregation of industry data related to electronic appraisals communicated via CCC’s electronic network or from total loss valuations processed by CCC. Where CCC Casualty is cited as a source, the data provided is an aggregation of industry data collected from claims data communicated via CCC Casualty’s electronic network.