

Q1


The Forces Shaping the U.S. Car Parc in 2025 and Beyond
The U.S. car parc is rapidly evolving, driven by technological advancements, economic shifts, manufacturer production trends, and changing consumer preferences and behaviors. Rising vehicle costs and higher interest rates are leading to longer vehicle ownership, with the average vehicle age projected to increase to 13 years by 2026. At the same time, the adoption of Alternative Fuel Vehicles (AFV) is accelerating, reshaping manufacturing, insurance models, and repair complexity.
Combined with the increase in Advanced Driver Assistance Systems (ADAS), the shift toward larger vehicles, and increasing vehicle complexity – particularly with EVs and hybrids - these forces are fundamentally transforming the makeup of the U.S. car parc.
As the industry adapts, stakeholders must navigate these shifts strategically to stay ahead. This Q1 2025 Crash Course report analyzes these trends and how they’re creating both challenges and opportunities for automakers, insurers, and repairers.
.svg)


CURRENT STATE OF THE U.S. CAR PARC
Internal Combustion Engine (ICE) Vehicles Still Dominate
As of Q3 2024, the U.S. car parc remains dominated by ICE vehicles, which account for nearly 95% of all vehicles on the road. This includes a mix of passenger cars, trucks, SUVs, and other light-duty vehicles. (Figure 1)

Experian reports that light duty vehicles, which represents the majority of the total ICE vehicle fleet in the U.S, grew to 292.1 million vehicles as of Q3 2024, an increase of 3.6 million vehicles over the prior year. This increase reflects both population growth and an increasing reliance on personal vehicles for transportation versus other mobility options such as public transportation, ride sharing, etc. (Figure 2)

While shared mobility services, such as Uber and Lyft, have grown in popularity, their impact on vehicle ownership trends has been more modest than initially anticipated. In most states, the oldest model year permitted under Uber’s company’s standards is 2008 (no older than 15 years from the current model year).
However, there is a clear shift in consumer preferences toward subscription-based ownership models, particularly for EVs, as consumers seek more flexible and cost-effective options. According to Experian, EVs are reaching just over 9% of new purchases and are leased at over 50% – nearly 20% of all new leasing. (Figure 3)

Consumers Buying Larger Vehicles
Within the light duty segment, data shows that SUVs and crossover utility vehicles (CUVs) now represent over 50% of the car parc for model years 2020 and newer – up from ~35% in 2014 - while traditional passenger cars have declined to less than 20% in recent model years. (Figure 4)

This trend reflects consumer demand for vehicles that are spacious and versatile, offering greater storage capacity to accommodate both family and lifestyle needs. This also reflects the types of vehicles being produced by auto manufacturers, which have largely shifted towards larger, more luxurious vehicles.
EV Growth Rate Slows
Data suggests that EV adoption has experienced significant acceleration, reaching approximately 4.2 million vehicles on the road in 2024 (hybrids account for ~9.6 million vehicles). While the volume of new EVs grew to over 1.3 million units in 2024, the rate of growth continues to moderate at +7.3%.
The year-over-year change in new EVs sold was almost +90% in 2021, +66% in 2022, and +50% in 2023. This trend indicates that while EV adoption continues to expand, the pace of growth is leveling off after the initial surge. (Figure 5)

This represents a nearly tenfold increase in EVs from 2018, highlighting a significant shift toward alternative fuel vehicles. EV sales also reached a record high in 2024, with 1.3 million new EVs sold. While this is still a small percentage of the total car parc, it represents a fundamental shift toward electrification. (Figure 6)

Car Parc Continue to Age
The average age of vehicles on the road in 2024 has grown from 11.4 years in 2014 to an estimated 12.7 years in 2024 and is projected to reach 13 years by 2026. (Figure 7)

For claims, the average age of vehicles has increased to 7.6 years – up from 6.9 years in 2020. The average age of repairable vehicles was 6.8 years in 2024 (up from 6.1 years old in 2020) and 10.6 years for total loss vehicles (up from 10.0 years old in 2020). (Figure 8)

Several shifts in consumer behavior and economic conditions are impacting the vehicle age on roadways today:
- Longer Vehicle Ownership: Consumers are holding onto their vehicles longer due to improved vehicle durability, increased repair options, and economic uncertainty.
- Shifts in Buying Preferences: Many buyers are delaying new vehicle purchases or opting for used vehicles due to high prices and financing costs.
- Longer Loan Terms: SUVs and crossovers now dominate new vehicle sales, often leading to higher costs that further extend ownership cycles, as the average new vehicle loan term is almost 69 months.
- Rising Vehicle Costs: The average price of a new vehicle has surged, making it more expensive for consumers to upgrade. The average new vehicle price has increased by $11,000 over the past 5 years.
- Higher Interest Rates: Auto loan rates have increased, making financing a new vehicle less affordable. The average APR for a new vehicle loan is up to 7.2% and 11.3% for used vehicles in February (Edmunds).
- Supply Chain Disruptions: Production slowdowns and parts shortages have limited new vehicle availability, driving up both new and used car prices.
- Inflation and Cost of Living Pressures: With rising expenses in housing, food, premiums, and other essentials, many consumers are prioritizing maintenance over replacement, or they’re simply not maintaining their vehicles at all.
The shift in consumer preferences and product offerings by manufacturers is evident in the increasing availability of larger vehicles, such as SUVs and CUVs, which now account for over 50% of the car parc for model years 2020 and newer, while the share of traditional passenger cars has declined to less than 20%.
The U.S. EV market has also seen a clear shift in consumer preferences and vehicle type production over time. Initially, older EVs (model years >11) were predominantly passenger cars, reflecting the early market focus on compact, efficient vehicles. However, in more recent years (model years 0-5), the EV landscape has diversified significantly, with CUVs, SUVs, and pickup trucks making up a larger share of new EV models. (Figure 9)

The rising cost of vehicles, influenced initially by supply chain disruptions and, more recently, by higher interest rates, has also played a critical role in shaping the car parc. Since the COVID-19 pandemic, vehicle production has been constrained, resulting in higher prices for both new and used cars. It is estimated that between 10 million and 13 million new vehicles were not sold over the past five years due to these disruptions. As a result, consumers are holding onto their vehicles for longer periods, contributing to the increasing average age of the car parc.
The share of repairable vehicles 7 years or older has increased by 9 percentage points since 2019, and vehicles 3 years or newer represented 38.5% of the repairable mix in 2019. At one point, this fell below 30% and resolved at 30.8% in 2024. (Figure 10)

EVs and Hybrids Increasing TCOR and Cycle Times
As the fleet continues to age, more vehicles on the road are past their initial warranty period, leading to higher maintenance and repair demands. EVs and hybrids are generally more expensive to repair, partly because of vehicle complexity and the need for specialized parts and expertise.
Over the past five years, labor rates for EV repairs have been consistently higher than for ICE vehicles, with EV labor rates approximately 30% higher as of 2024. The average cost of EVs was $830 more per repair than hybrids and over $1,030 more than ICE vehicles in 2024.
While EV labor costs are higher, their total parts costs were $175 lower than hybrids but still $290 higher than ICE vehicles. Hybrids, on the other hand, averaged nearly $470 more in parts costs compared to ICE vehicles, and required $200+ more in labor costs than ICE vehicles. (Figure 11)

Another significant factor driving the gap is the time required for repairs. On average, EV repairs took nearly three more labor hours than hybrid repairs and four more hours than ICE repairs, likely due to the additional complexity of EV components and safety systems. Even hybrids required more time for repairs, averaging 1.1 more labor hours than ICE vehicles. (Figure 12)

More Parts Needed, But Fewer Parts Available
The number of parts replaced during repairs reflects the differences in complexity. EVs averaged 22 parts per repair, hybrids averaged 18.5 parts, and ICE vehicles had 15.9 parts replaced on average. This underscores the intricate nature of both EV and hybrid technologies compared to traditional ICE vehicles, influencing both repair time and costs. (Figure 13)

The availability of parts for aging vehicles is another growing concern. As the car parc becomes more diverse in terms of age, make, and model, repair shops must stock a wider variety of parts to meet the needs of different vehicles. This increases the complexity of supply chain management and can lead to longer repair times, particularly for older or more specialized vehicles. Similar concerns exist for newly introduced models where scarcity of replacement parts can limit repair options.
ADAS Driving Up Diagnostics Frequency and Cost
Another key factor impacting repair complexity is the proliferation of ADAS. The Highway Loss Data Institute estimates that by 2028, six ADAS systems will be present in half or more registered vehicles.
Approximately 76% of registered vehicles will be equipped with rear cameras, 51% with front automatic emergency braking, and over 50% with lane departure and/or blind spot monitoring capabilities. Even less prevalent ADAS technologies like adaptive cruise control with lane centering and curve-adaptive headlights will come standard in 21% and 14% of registered vehicles, respectively. (Figure 14)

While it may improve vehicle safety in the long-term, ADAS-equipped vehicles also require more frequent calibration and diagnostic procedures, which continue to drive up repair costs. In analyzing data of ICE, Hybrid, and EV vehicles serviced by shops in Direct Repair Programs (DRPs) and aged 3 years or newer – several unique diagnostic trends have emerged:
- Overall, DRPs include a scan on almost 90% of vehicles 3 years or newer. EVs have a lower scan percentage relative to other fuel types. Hybrids included a slightly higher scan rate than industry. (Figure 15)
- Hybrid estimates include calibrations almost 10 percentage points higher than industry and over 7 points higher than EVs. This points to the complexity of technology integrated into hybrid vehicles. (Figure 15)
- The industry average fees for scans are slightly higher for both EVs and even higher for hybrids. (Figure 16)
- Calibrations by fuel type expose even further differences between EVs, hybrids, and ICE vehicles. While the average calibration per claim with diagnostic operation was almost $550 in Q4 2024, hybrid vehicles averaged almost $80 more than industry and ICE vehicles, meanwhile, EVs were over $130 less than the industry average and over $210 less than hybrids. (Figure 16)


Implications for the Automotive Industry
Vehicle Parts Availability
The availability of vehicle parts has become a key factor in determining repairability, especially for alternative fuel vehicles. When a hybrid or EV crashes, the challenge often isn't just repairing the damage, it’s finding the right parts to complete the job. Lack of parts availability can render a repairable vehicle a total loss, leaving the consumer frustrated with insurers facing higher claim payouts. This illustrates how dependent the future car parc is on supply chain dynamics.
For underwriters, the scarcity of parts for certain models may prompt a reconsideration of how they approach insuring these vehicles. Some may opt not to insure hard-to-repair cars, or at the very least, adjust premiums to reflect the additional risk.
Meanwhile, repair shops face the complexity of accessing these parts. For instance, modern cars often require breaking clips and other auto components to access a single part, forcing repairers to replace more than what's visibly damaged. This complexity reflects a broader theme in the industry: the more advanced a vehicle, the more intricate its repair needs.
Diagnostics & Repair for Emerging Segments
As the car parc has shifted to include more elaborate, technology-infused vehicles, the frequency and sophistication of scans and calibrations has grown significantly, adding layers of complexity to what used to be straightforward repairs.
For example, something as simple as calibrating a vehicle's ADAS system may require removing upholstery or disassembling interior parts. It's a process that drives up the cost of repairs, which in turn affects both consumers and insurers.
Total Cost of Repair
The cost of repairs has more than doubled over the last decade, and many states have responded by increasing minimum liability limits, but as vehicle values rise, so do repair costs, creating a feedback loop where the expense of insuring a vehicle climbs alongside the costs to fix it.
For insurers, the cost to repair vehicles is a growing concern. As premium rates increase to cover these and other expenses, insurers and repairers must work together to find ways to mitigate these rising costs. Repairing advanced vehicles requires expertise and access to specialized parts. And when parts are unavailable or repairs are too expensive, vehicles can become disposable, leaving the industry and consumers in a precarious position. The challenge of what to do with totaled electric vehicles when parts are scarce is particularly pressing.
Customer Dissatisfaction
When the cost to repair a vehicle exceeds the cost to purchase it, consumers face difficult decisions, often resulting in the vehicle being classified as a total loss. This reality is especially painful for consumers who are told their drivable and repairable vehicle is now considered totaled, simply because the repair costs outstrip the value of the car. For consumers who own older vehicles outright, if their vehicle is still drivable but costs more to fix than it’s worth, the emotional and financial toll is significant. (Figure 17)

The dissatisfaction deepens when parts for EVs are scarce or unavailable. In these instances, the repair process gets drawn out, or worse, the vehicle becomes unsalvageable, leaving the consumer without transportation. This situation can negatively impact the policyholder’s experience. In fact, CCC’s Moments of Truth study revealed that the customer’s satisfaction with their ability to get a rental after an accident was a top contributor to their satisfaction with their auto insurer.
For an industry that’s increasingly customer-focused, the inability to meet consumer needs in this area highlights a major gap that must be addressed. Repairers and insurers need to find ways to manage these costs and avoid situations where their customers are left feeling let down by the process.

Future Outlook
Looking ahead, the U.S. car parc is expected to continue evolving. The penetration of EVs and hybrids will likely increase, driven by advancements in battery technology, government incentives, and consumer demand for environmentally friendly vehicles. By 2028, it is projected that EVs and hybrids could represent as much as 15% of the car parc.
In terms of ownership models, the rise of subscription services and shared mobility options will continue to reshape how consumers interact with vehicles. While personal ownership will remain dominant, younger generations may increasingly opt for flexible alternatives, particularly as EVs become more integrated into these models, particularly in urban and suburban settings.

Final Thoughts
The evolving U.S. car parc presents both challenges and opportunities. The increasing complexity of vehicles is reshaping repair processes and claims management. At the same time, economic factors such as rising vehicle costs and interest rates are influencing consumer behavior, leading to an aging fleet and shifts in ownership models.
The future of the U.S. car parc will continue to transform, driven by electrification, technological innovation, and economic forces. By staying ahead of these trends, industry stakeholders can position themselves for long-term success.


APD Industry Data
Paid Claim Trends
Paid claim frequency for 1st party coverages (collision and liability) continue to trend down slowly. Underlying drivers of frequency – paid count and exposure units – both continue to decline despite growing size of overall car parc. Liability paid frequency remains very stable.
Through November 2024, miles driven was +0.9% relative to both 2023 and 2019. Miles driven will be one to monitor in 2025, as many large corporations are bringing associates back into the office. (Figure 1)

Total losses continue to represent a larger share of claims. Contributing factors, such as declining vehicle values, aging car parc, and a declining share of lower dollar claims being reported, continue to shift the claims mix. (Figure 2)

Wholesale used vehicle values (Manheim & Black Book) generally declined during the first half of 2025. Manheim and the consumer price index for used vehicles (retail) continue to indicate increases in used vehicle values. Supply and demand dynamics, including price and interest rates, are at the top of my watchlist for 2025. (Figure 3)

The share of claims flagged total loss was a record in 2024 – based on CCC’s historical trends. Declining used vehicle values and an aging car parc, on top of catastrophic events, drove these results. Also keep in mind that most of the estimates from Hurricanes Helene and Milton were completed in Q4 2024. (Figures 4 and 5)


The age mix of non-comprehensive valuations is highly representative of the age vehicle mix within the U.S. car parc. Over 70% of total loss valuations in 2024 were on vehicles 7 years or older. Older vehicles continue to represent a large share of the vehicle pool, while we see less representation from newer vehicles, a reflection of decreased new vehicle sales since 2020.
Average adjusted vehicle values (AAVV) on non-comprehensive valuations were -6% year-over-year in 2024 and -10% relative to 2022. AAVVs remain +34% relative to 2020. (Figure 6)

Per NICB, over one million vehicles were stolen in 2022 and 2023. Vehicle thefts were exacerbated by technology and social media, especially for certain Hyundai and Kia models. Following a slight reprieve, the latter part of 2024 began to see an increased share of thefts relative to total losses.
Given the state of auto finance – where almost 3% of auto loans slipped into serious delinquency in Q4 and 25% of new vehicle loans are under water by an average amount of almost $7,000, it would not be surprising if morale hazard and fraud are contributing to the increase in theft. (Figure 7)

Total Cost of Repair Trends
The average total cost of repair (TCOR) seems likely to finish 2024 between +3 to +4% year-over-year. This would be the lowest increase since 2017.
Increases in repair costs have been mitigated by the increase in total losses and age mix. However, there are a variety of underlying factors which continue to put upward pressure of repair costs, including labor rates and diagnostics. (Figure 8)

Part dollar contributions to repair cost increases continue to shrink relative to labor and miscellaneous costs – which often include diagnostics. (Figure 9)

Average part prices had been relatively flat between 2022 and 2023. However, prices did begin to show signs of inflation beginning in Q2 2024. Part prices are generally the top concern for the repair ecosystem as the United States has begun to announce and roll out a variety of tariff measures. (Figure 10)

Industry part utilization was down slightly in 2024 at 13.5 parts per repair estimate. Much of this could be attributed to repairable age mix and increased total losses. (Figure 11)

Like part volume, average labor hours saw a slight decline in 2024. This could be attributed to repairable age mix and increased total losses. (Figure 12)

Labor rates continue to be a major driver of year-over-year repair cost increases. The 4.5% average increase in 2024 reflects a slowing rate of increase. 2023 was +7.5% year-over-year. Average labor rate increases continue to near the inflation rate as we enter 2025. (Figure 13)

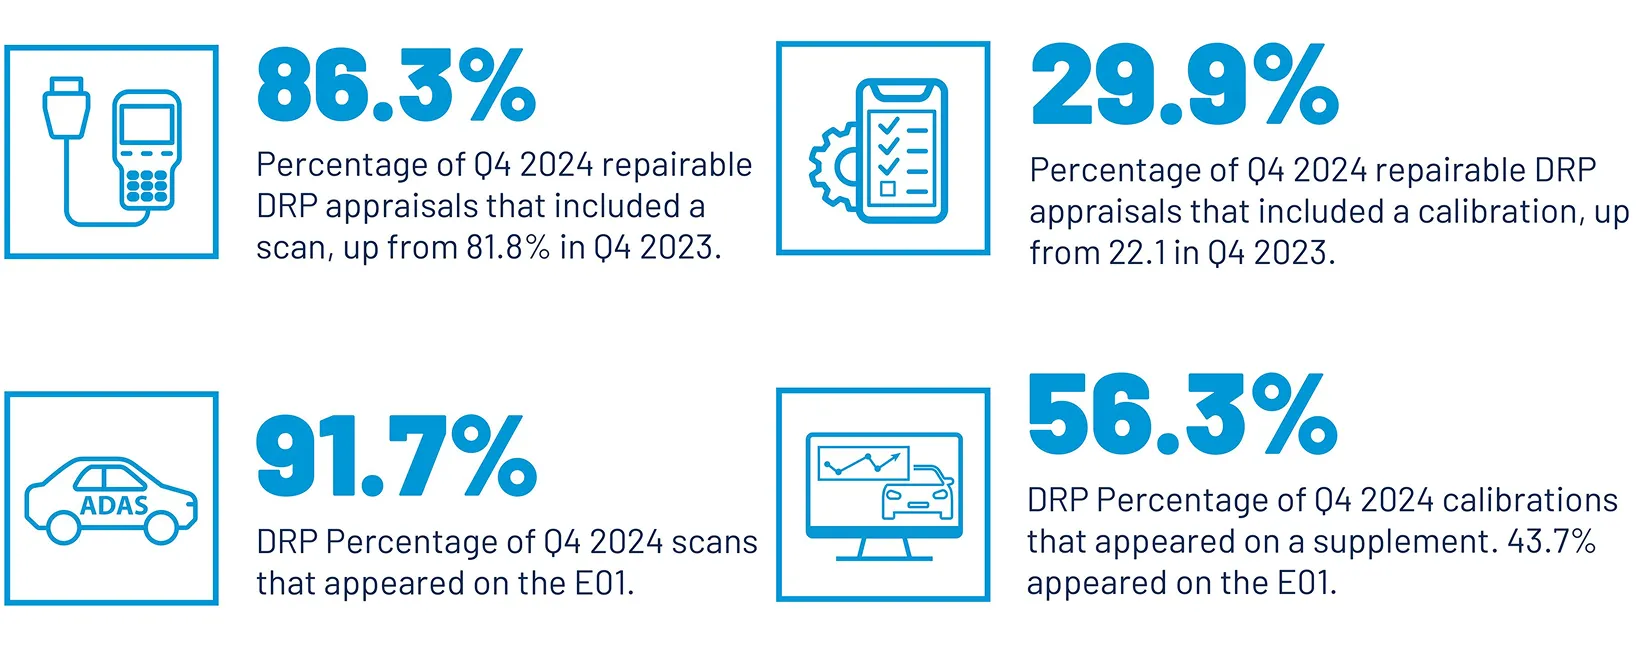
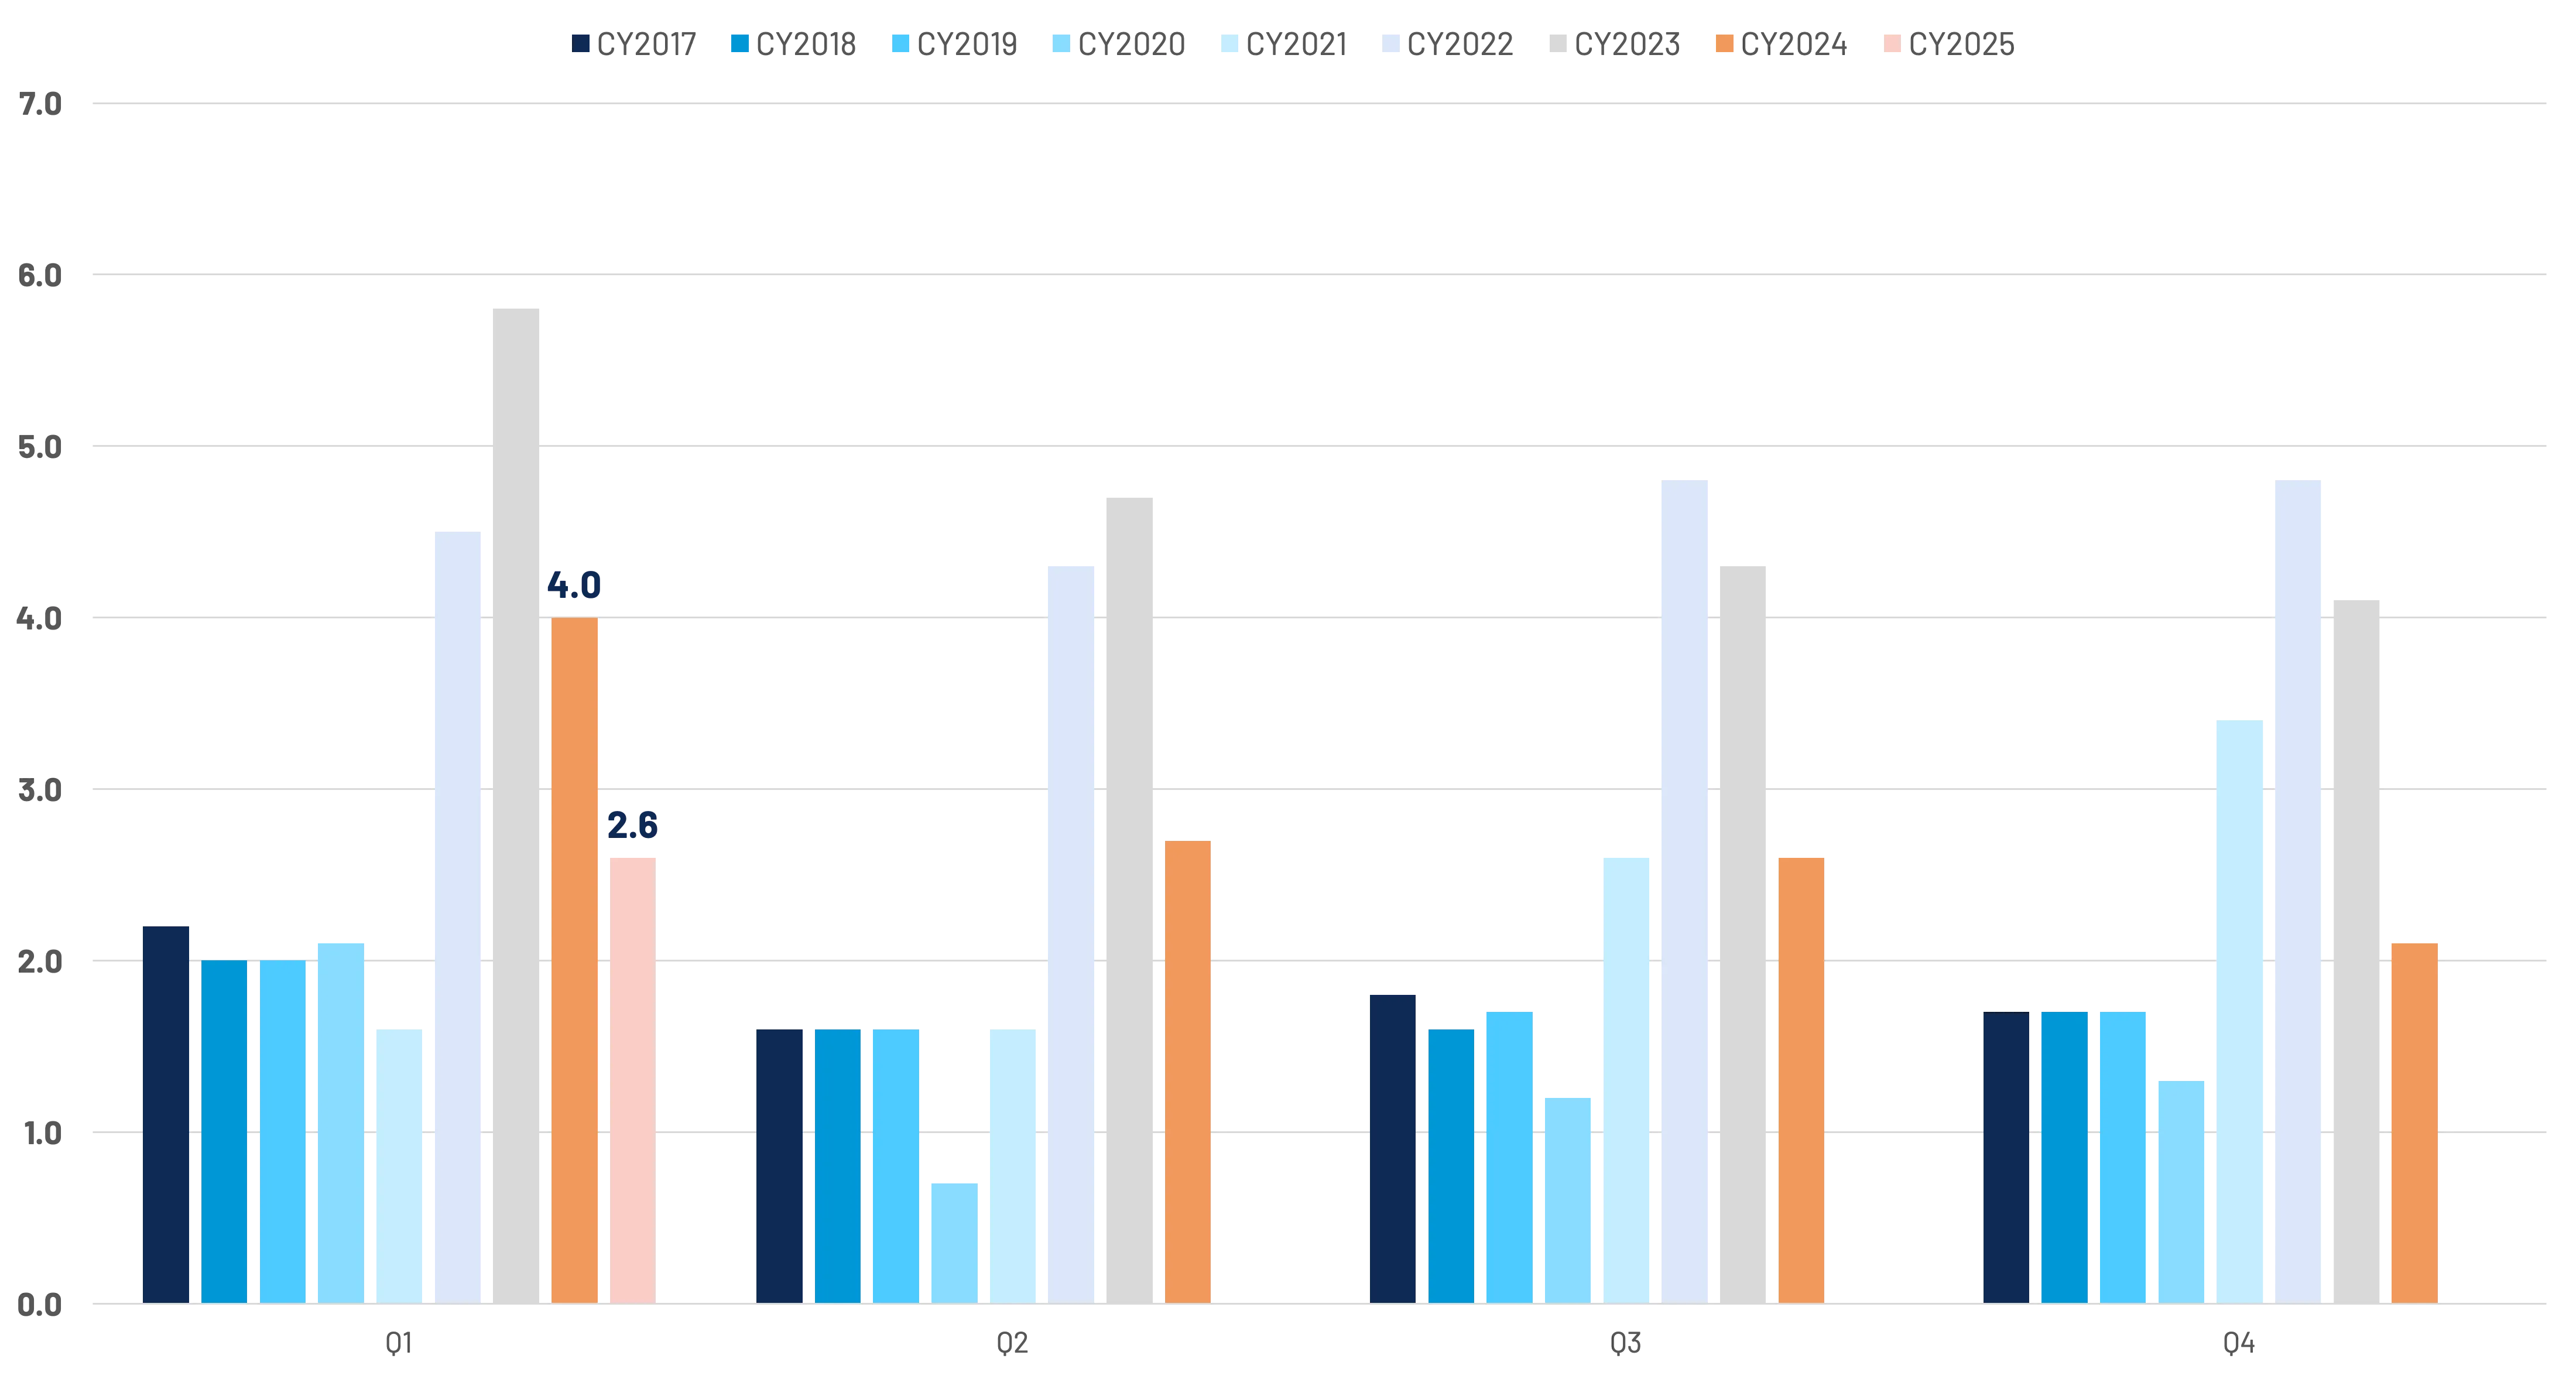
As we discussed previously, ADAS features continue to proliferate. This is reflected in the continued increase in appraisals that include diagnostic operations - namely, scans and calibrations. The share of DRP appraisals that included a scan pierced the 85% mark in 2024, while calibrations are trending towards 30%. The inclusion of calibrations is accelerating at a rate similar to what we saw with scans in recent years and implies a continued increase in repair costs. While over 90% of scans are included in the initial DRP estimates, the majority of calibrations appear on supplements, requiring additional review and approval time while vehicles are in the process of being repaired. (Figure 14)
Shop Productivity Trends
Method of inspection trends reflect a continued reliance upon direct repair programs to complete appraisals on behalf of insurance carriers. Carriers continue to evolve their mix of inspection solutions to meet the needs of their clients and long-term staffing and operations objectives. An increased total loss propensity adds additional pressure in getting vehicles to the right place – a shop or salvage yard – the first time. (Figure 15)

Shop backlogs continue to improve on a year-over-year basis. Where we saw more heavier hit vehicles being repaired in 2022 and 2023, decreased vehicle values has increased total loss frequency, accounting, at least in part, to improved cycle times. Claims volumes, which remain down year-over-year, are also contributing to improved backlogs. (Figure 16)
Improved backlogs and increased total losses are also reflected in improved cycle times. The average time between last estimate assignment sent and vehicle in (to the shop) is less than half of the days required in Q4 2022. Overall repair days are down almost 2 days in total from their peak yet remain up by 4-5 days relative to 2020. Factors such as increased supplement handling and technician shortages could be contributing to elongated repair times. (Figure 17)

The share of non-driveable repairable claims in 2024 was relatively flat compared to 2023. Daily productivity – measured by labor hours per repair day, indicated modest, yet noticeable improvements year-over-year, especially with non-driveable vehicles. Given the increased propensity for repairs to include supplements, productivity improvements will likely rely upon improved communication and process efficiency between shops and insurance carriers. (Figure 18)


Casualty Industry Data
Third Party Trends
Bodily injury claim frequency has been increasing despite property damage and PIP claim frequency decreasing over the last 2 years. (Figure 1)

Average 3rd party bodily injury paid outcome is now $27.6K per injured party, which represents an 8% increase since Q3 2023 and a 35% increase since Q3 2020. (Figure 2)

Both First and Third Party Auto Medical Billing inflation rates have been consistently outpacing the Consumer Price Index for Health Care. (Figure 3)

Third party bill line severity has increased 4.1% since Q4 2023. (Figure 4)

The largest severity increases in key volume states since Q4 2023 have occurred in Arizona, Virginia, California, and Washington. (Figure 5)

Distribution of procedure dollars shows increases in Radiology, Evaluation and Management, and Surgical as of Q4 2024. (Figure 6)

Drilling further into procedure category gains, price increases occurred in nearly all subcategories, with bill frequency increases also occurring for CT scans, MRIs, X-rays, Surgeries, Injections, and most Evaluation & Management. (Figure 7)

The average CT Scan charge has increased 45% since 2020, and 16% since 2023, while also moving closer to avg three CT scans per injured party (when ER treatment present). (Figure 8)

The average number of days between date of loss and treatment continues to decrease for outpatient surgery and diagnostic procedures, with notable cost increases on those same procedures. (Figure 9)

PRP procedures (0232T, P9020) continue to increase rapidly in frequency. The PRP code 0232T is now the 6th highest surgical procedure by total dollar amount billed. (Figure 10)

The percentage of third party claims submitted for injuries caused by an uninsured or underinsured motorist remains elevated (+2% since Q4 2023). IRC estimates that a full one third of motorists were uninsured or underinsured as of 2023, with that number likely to have grown due to premium increases. (Figure 11)

First Party Trends
PIP claim paid outcome per injured party has increased 4% since Q3 2023. (Figure 12)

First party bill line severity has increased 7.9% since Q4 2023. (Figure 13)

First party bill line severity has increased 7-8% in both PIP required states and All Others since Q4 2023. (Figure 14)

For key volume states, the most notable line level increases since Q4 2023 have occurred in Massachusetts, New Jersey, Ohio, Washington, Kentucky, North Carolina, and Michigan. (Figure 15)

Distribution of procedure dollars shows notable increases in Radiology, Surgical, and Evaluation & Management as of Q4 2024. (Figure 16)

Drilling further into Radiology, Surgical, and Evaluation and Management growth, movement is driven by both cost and frequency increases within most procedure subcategories. (Figure 17)

Outpatient surgery and radiology procedures are occurring earlier in the treatment cycle compared to prior year, consistent with third party trends. (Figure 18)

We’ve seen notable year over year growth in injured parties aged 61-90, reflective of macro aging population trend. (Figure 19)

The average treatment duration has increased 29% over the last year, while procedure counts have increased 34%. (Figure 20)


Intelligent Solutions
Collision Repairers
Our solutions help repairers run more efficient body shop businesses, while making repair decisions simpler and faster.
Insurance Carriers
Our solutions help insurers make more confident decisions earlier, creating intelligent claims experiences that are more connected for their employees and more compassionate for their policyholders.
Auto Manufacturers
Our solutions help auto manufacturers enhance their consumers’ repair experiences, while connecting them to the industry’s largest repair network.